


For public transport authorities

Design timetables for the whole network

Design, analyse and optimise timetables in one environment. See how each change affects the entire network, work with real-world data and prepare publication-ready outputs without moving work between tools.

„Our cooperation is proof that Codimi will build exactly the product you need."
Marcin Czapnik · Head of the Transport Services Division, ZTM Gdańsk

One system · the whole workflow

From source data to a finished timetable

Manage the entire planning process in one consistent data model — from importing the existing timetable, through designing and analysing variants, to optimisation and publication. Every change remains part of the same project, so you can assess its consequences without manually moving data between files and tools.

01 Import

Existing data migration

Start with the network you already have

Import your existing timetable and use it as the starting point for the next project. Stops, lines, variants, runs and operational data do not have to be recreated from scratch.

Work on a copy of the timetable currently in force, retaining the existing network structure while preparing the next change in a controlled environment.

  • GTFS
  • TransXChange
  • Stop network
  • Lines and runs
  • Tasks and duties

02 Design

A complete transport model

Design the network, timetable and operations in one place

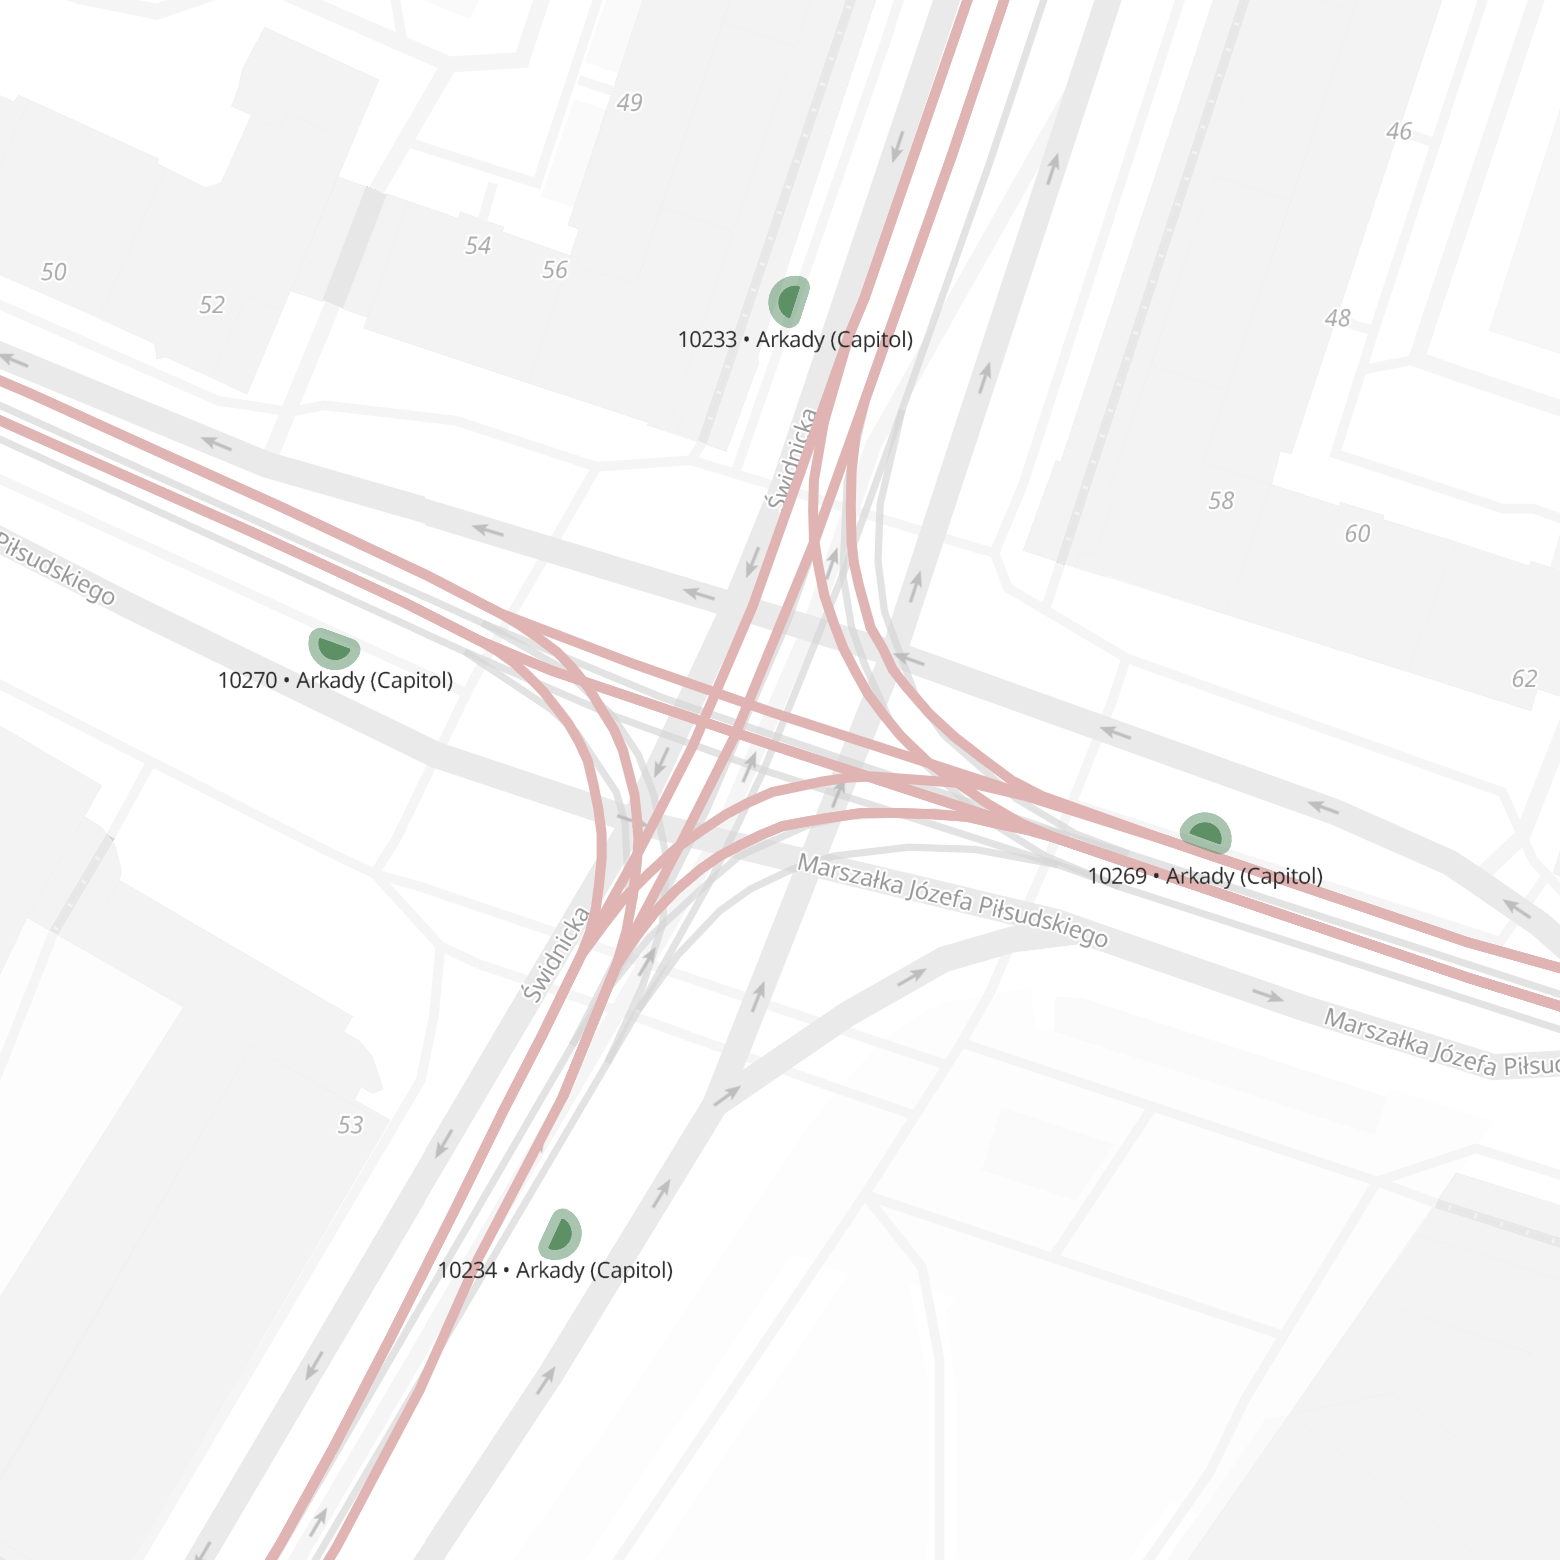
Add stops and segments, map routes, create lines, variants and runs, then use them to build transport tasks and duties.

The system continuously validates project consistency and helps you catch items that need correction before publication.

  • Stops and segments
  • Lines and variants
  • Runs
  • Tasks and duties

03 Analyse

The network in numbers

See the impact before you implement a change

Analyse transport work by line, area, operator or vehicle type. Compare the project with actual travel times and vehicle occupancy, assess service regularity and transfers, and review alternative timetable variants.

This lets you make decisions based on the entire network, rather than a single run or spreadsheet.

  • Vehicle-kilometres and transport work
  • Actual travel times
  • Vehicle occupancy
  • Regularity and transfers
  • Variant comparison

04 Optimise

Decisions based on data

Find a better option without losing control of the network

Align travel times with real conditions, coordinate runs and transfers, and improve the use of transport tasks and vehicle blocks. Work manually or use algorithms that help identify more efficient options.

After every change, you can see its effect on related timetable elements and identify areas that require further review.

  • Travel time adjustment
  • Corridor synchronisation
  • Transport tasks
  • Automatic Vehicle Scheduling
  • Efficiency

05 Publish

A single source for publication

One approved version. Every output you need.

Once planning is complete, create an approved timetable version with a defined validity period. Use it to prepare data and documents for operators, downstream systems and passengers.

Generate supported data exchange formats, stop timetables, driver run sheets, reports and visualisations from a single source.

  • GTFS
  • TransXChange
  • NeTEx
  • Stop timetables
  • Driver run sheets
  • Reports and visualisations

Timetable design made easier

Design with full awareness
across the entire network

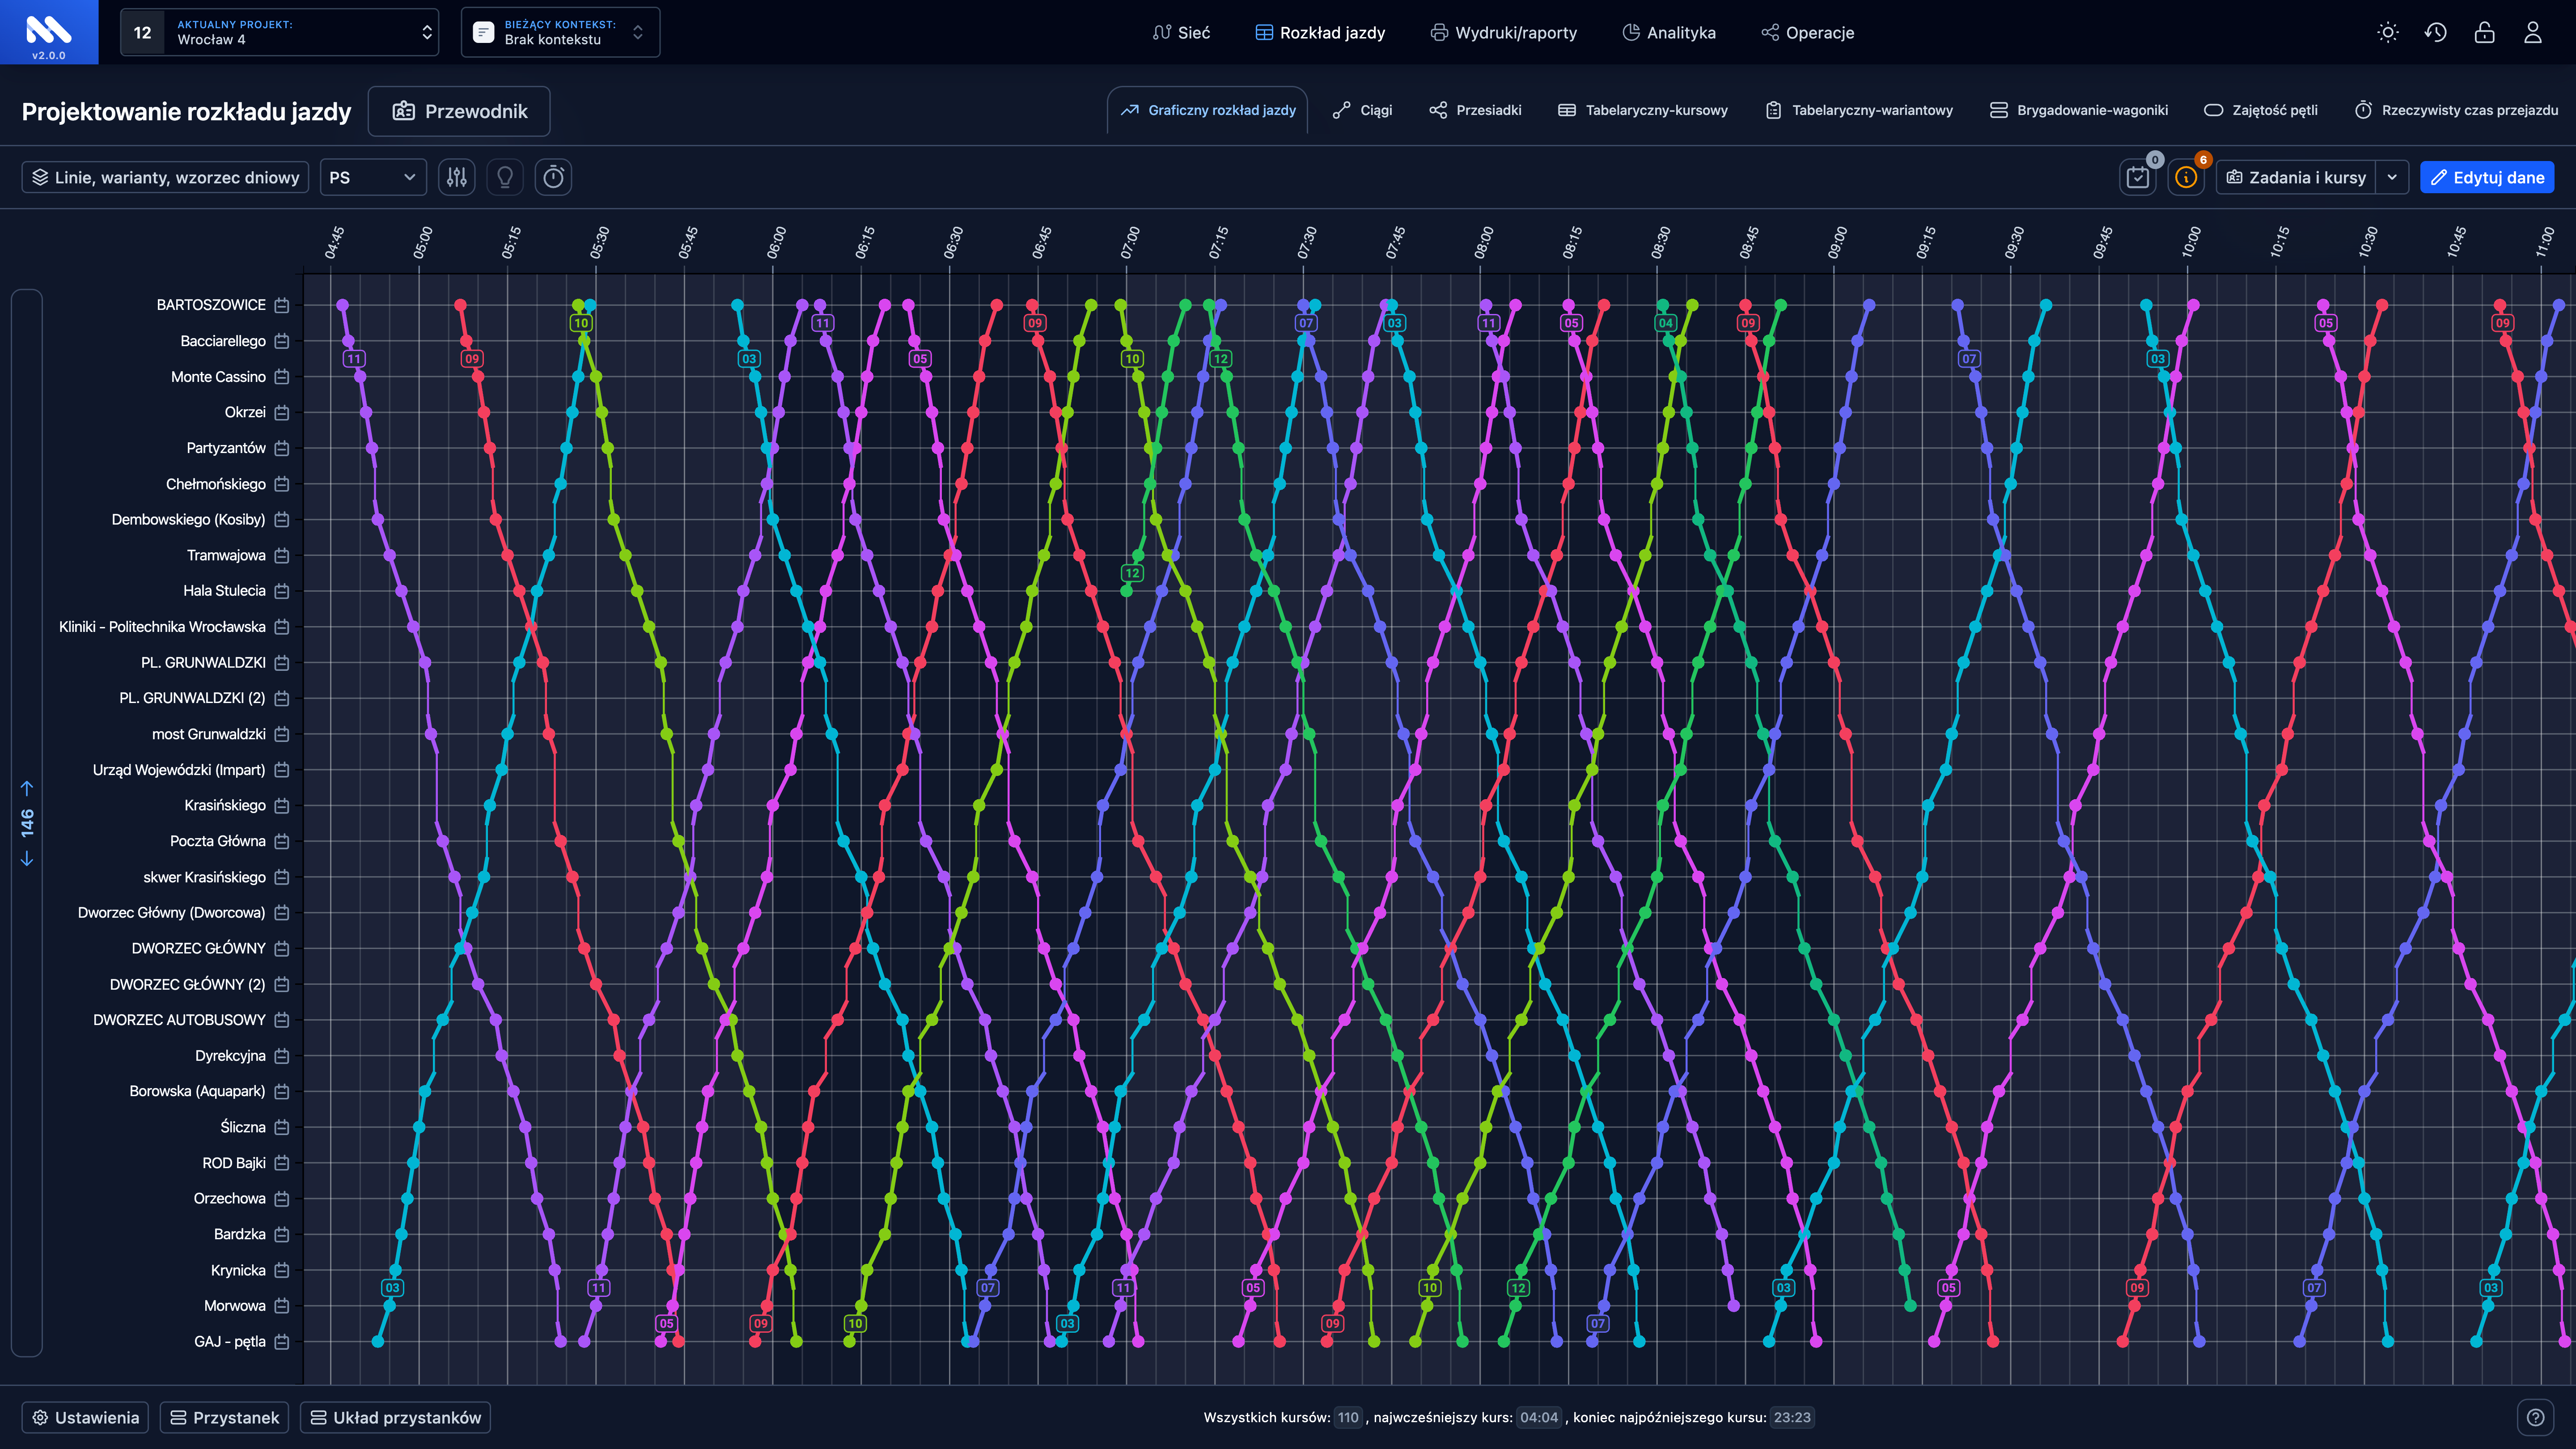
Every timetable change affects other runs, lines, transfers and transport tasks. BusHarmony brings these dependencies together, so you can assess the consequences of a decision before publication.

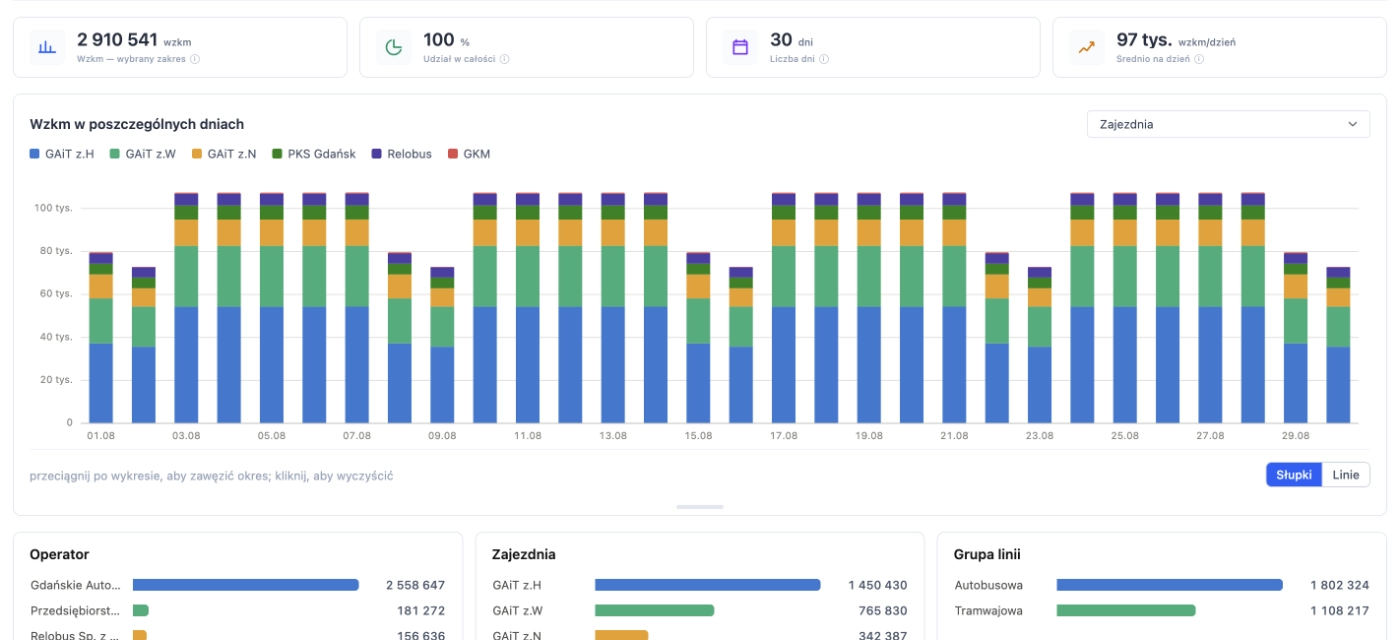
Vehicle-kilometre analysis

Analyse transport work directly from project data

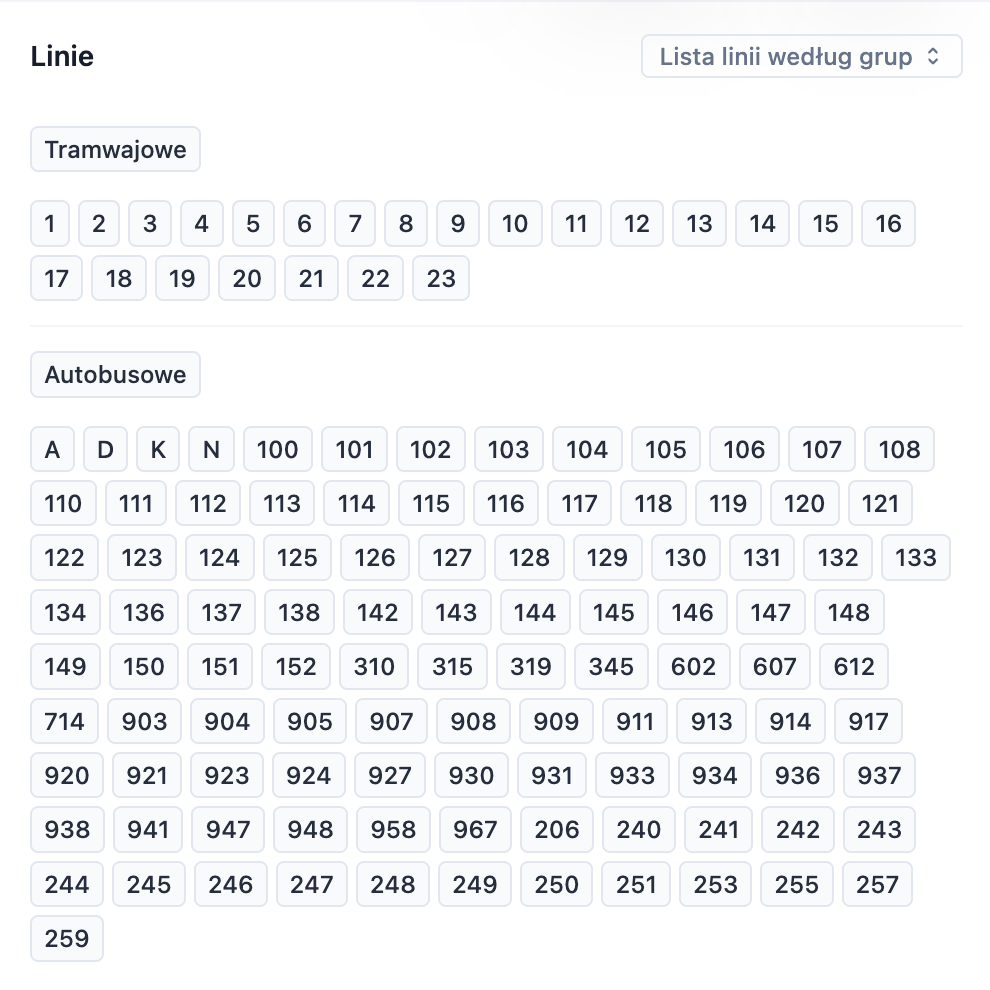
How many vehicle-kilometres do you run over two days in a given municipality? How many fall on a specific line or settlement area?

BusHarmony calculates transport work directly from your project data. Choose the period, area, lines, operator or vehicle type and view the result in the breakdown you need.

Complex analyses without manual calculation, exports and yet another spreadsheet.
Real-world data · travel times

Plan based on what actually happens.

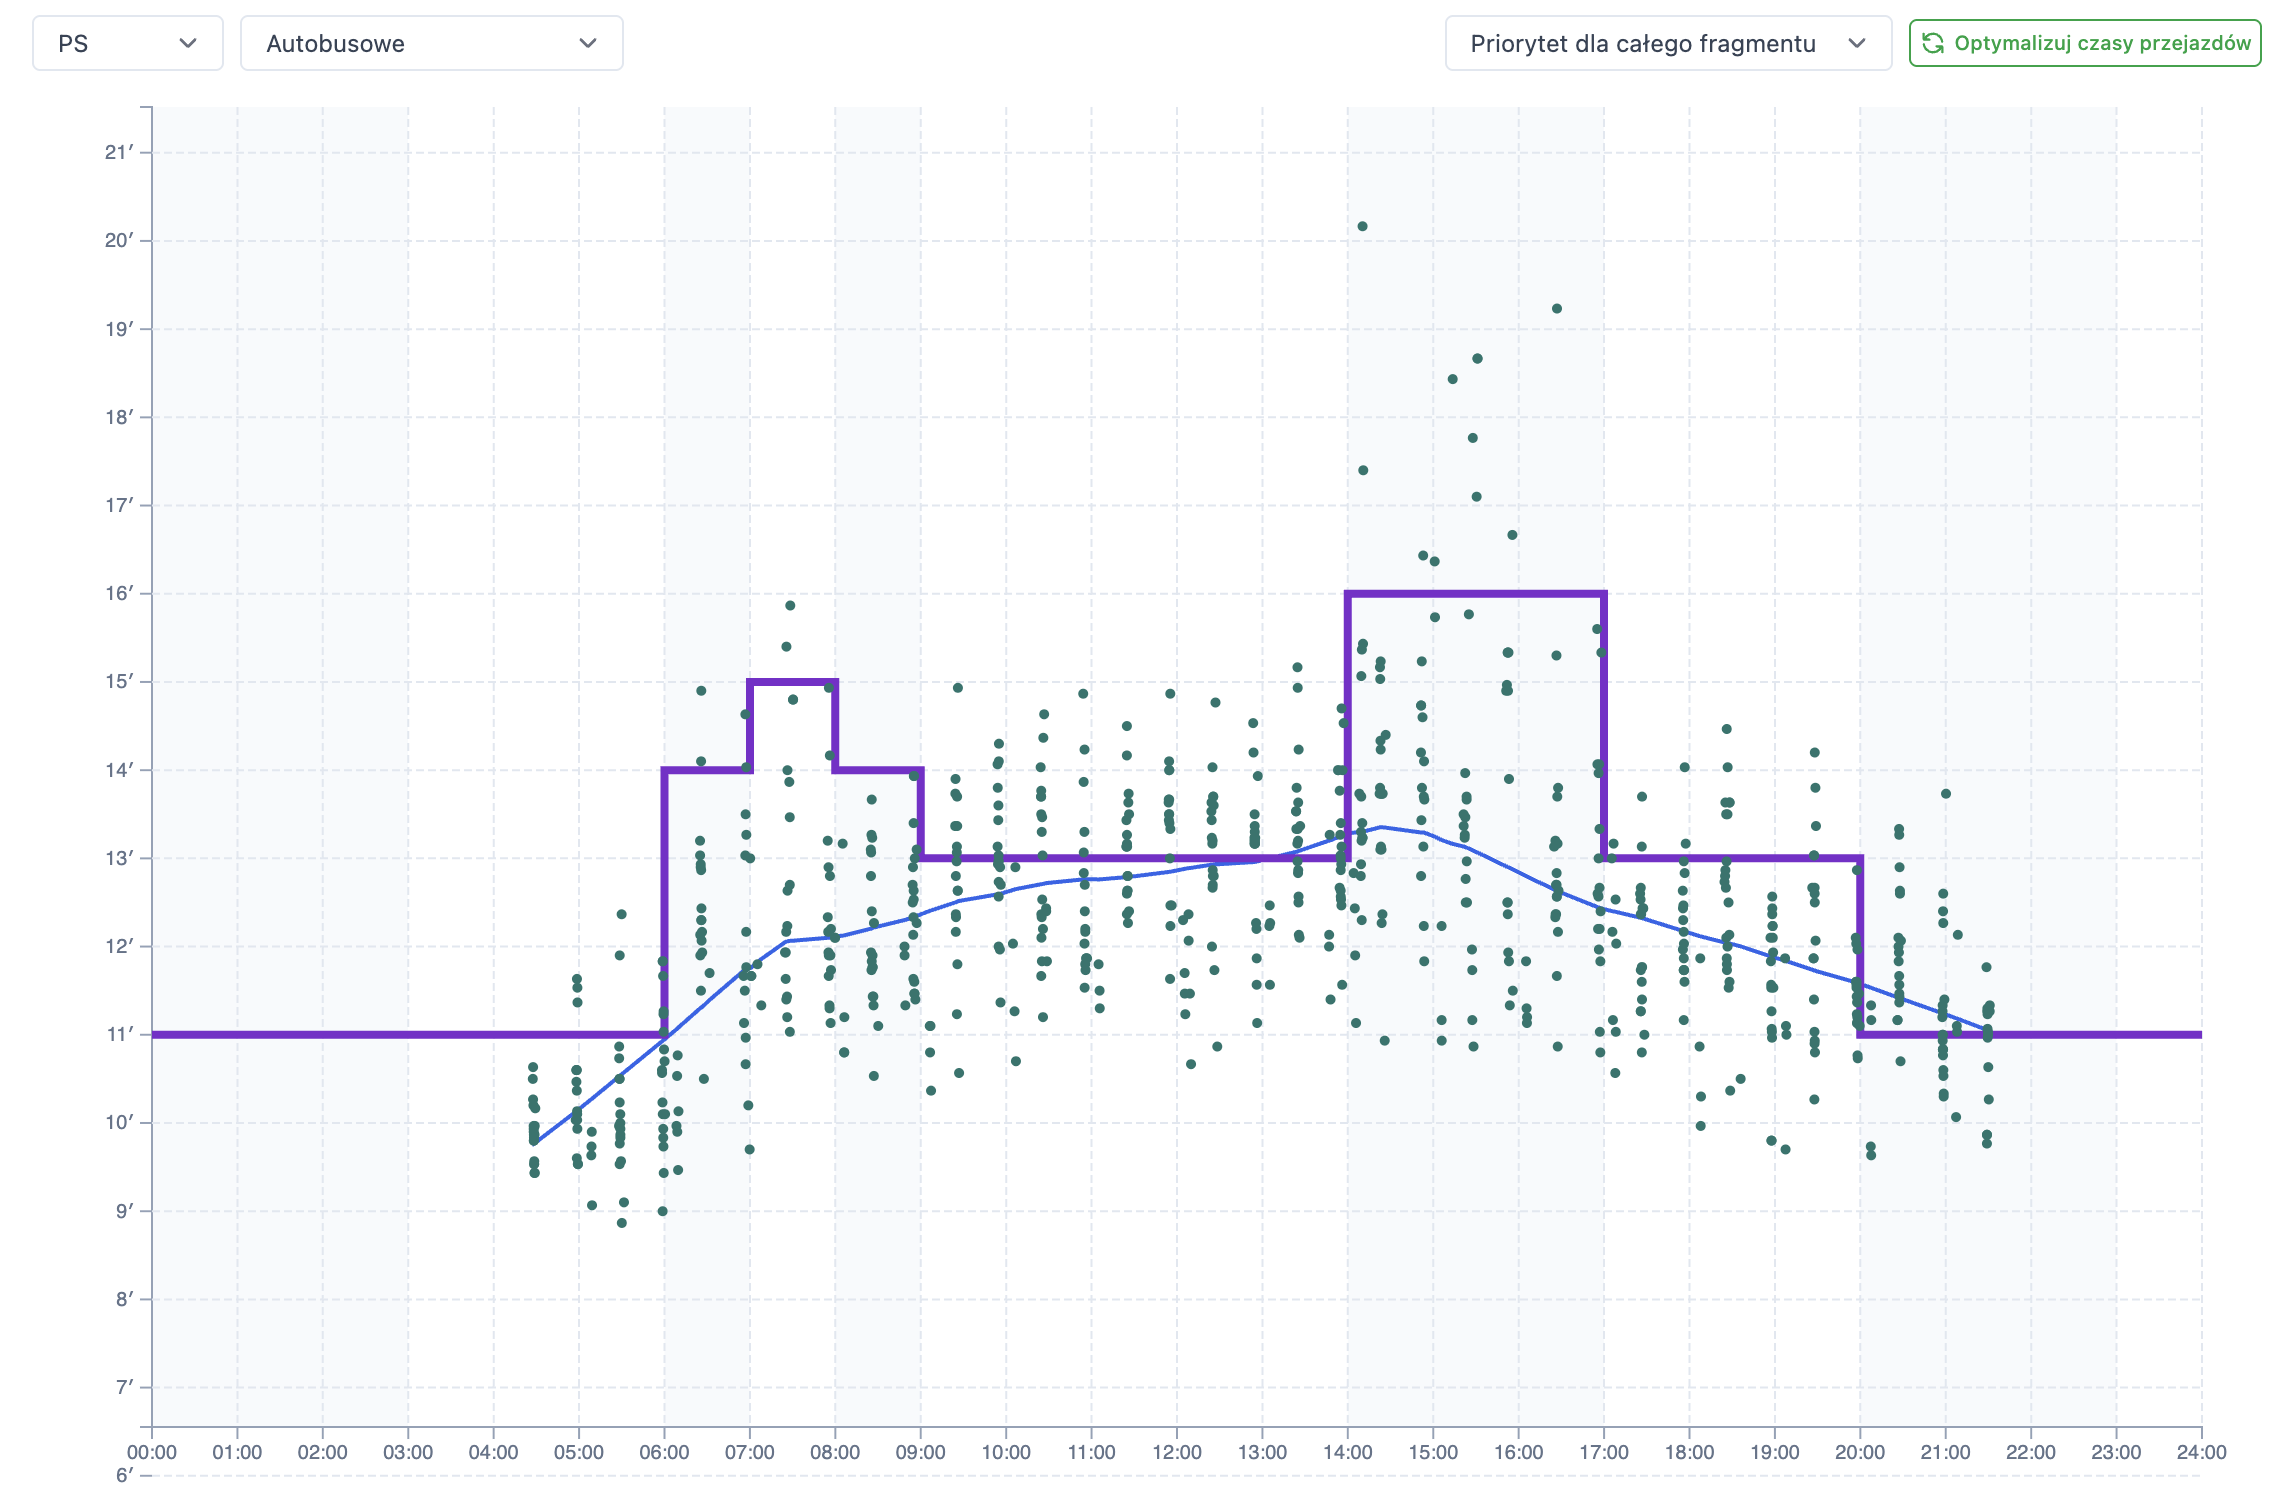
Compare timetable assumptions with actual travel times from completed runs.

BusHarmony shows differences by segment, direction and time of day, helping you identify where planned travel times need adjustment.

Bring travel times in line with reality, reduce delays and build timetables that can actually be delivered.

Real-world data · vehicle occupancy

See where capacity is really short.

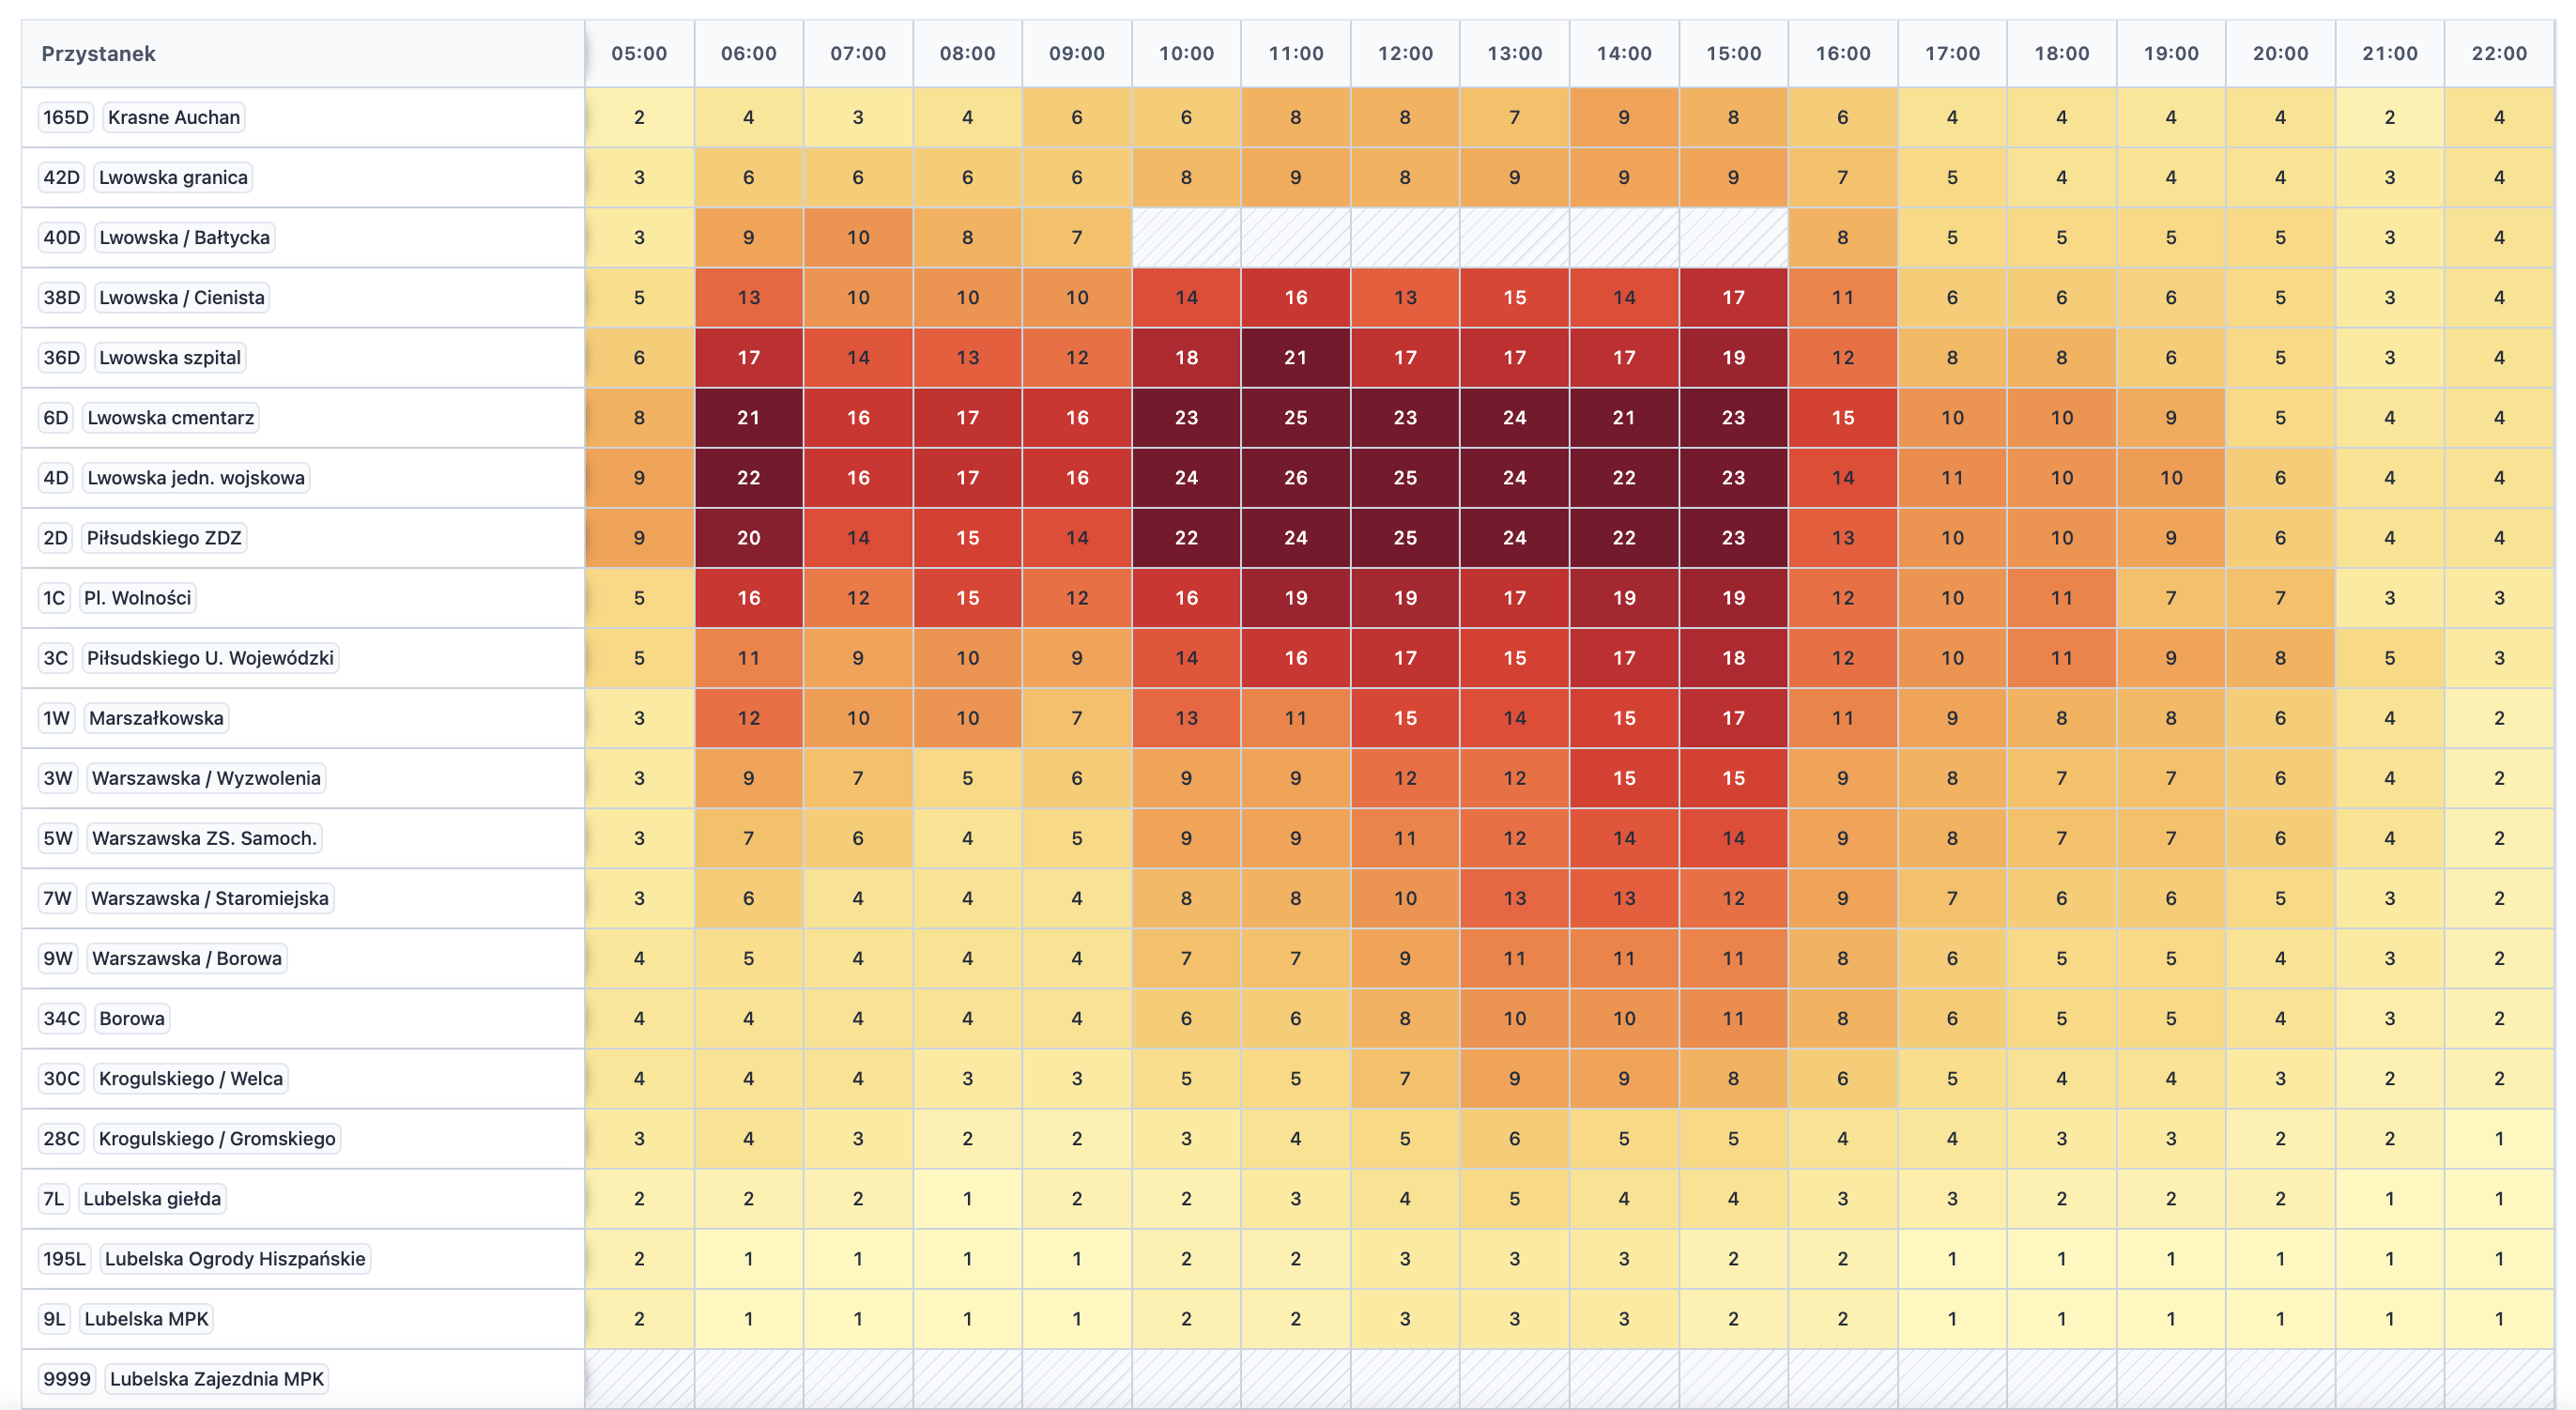
Passenger numbers change from stop to stop and from run to run. Punctuality alone will not show you where vehicles are overcrowded and where their capacity goes unused.

BusHarmony combines occupancy data with the timetable, route and vehicle type. This shows where and when vehicles approach their capacity limits, as well as where available capacity remains unused.

Match frequency and vehicle capacity to where passengers actually need them.

Run synchronisation

Keep the headway. Across the whole network.

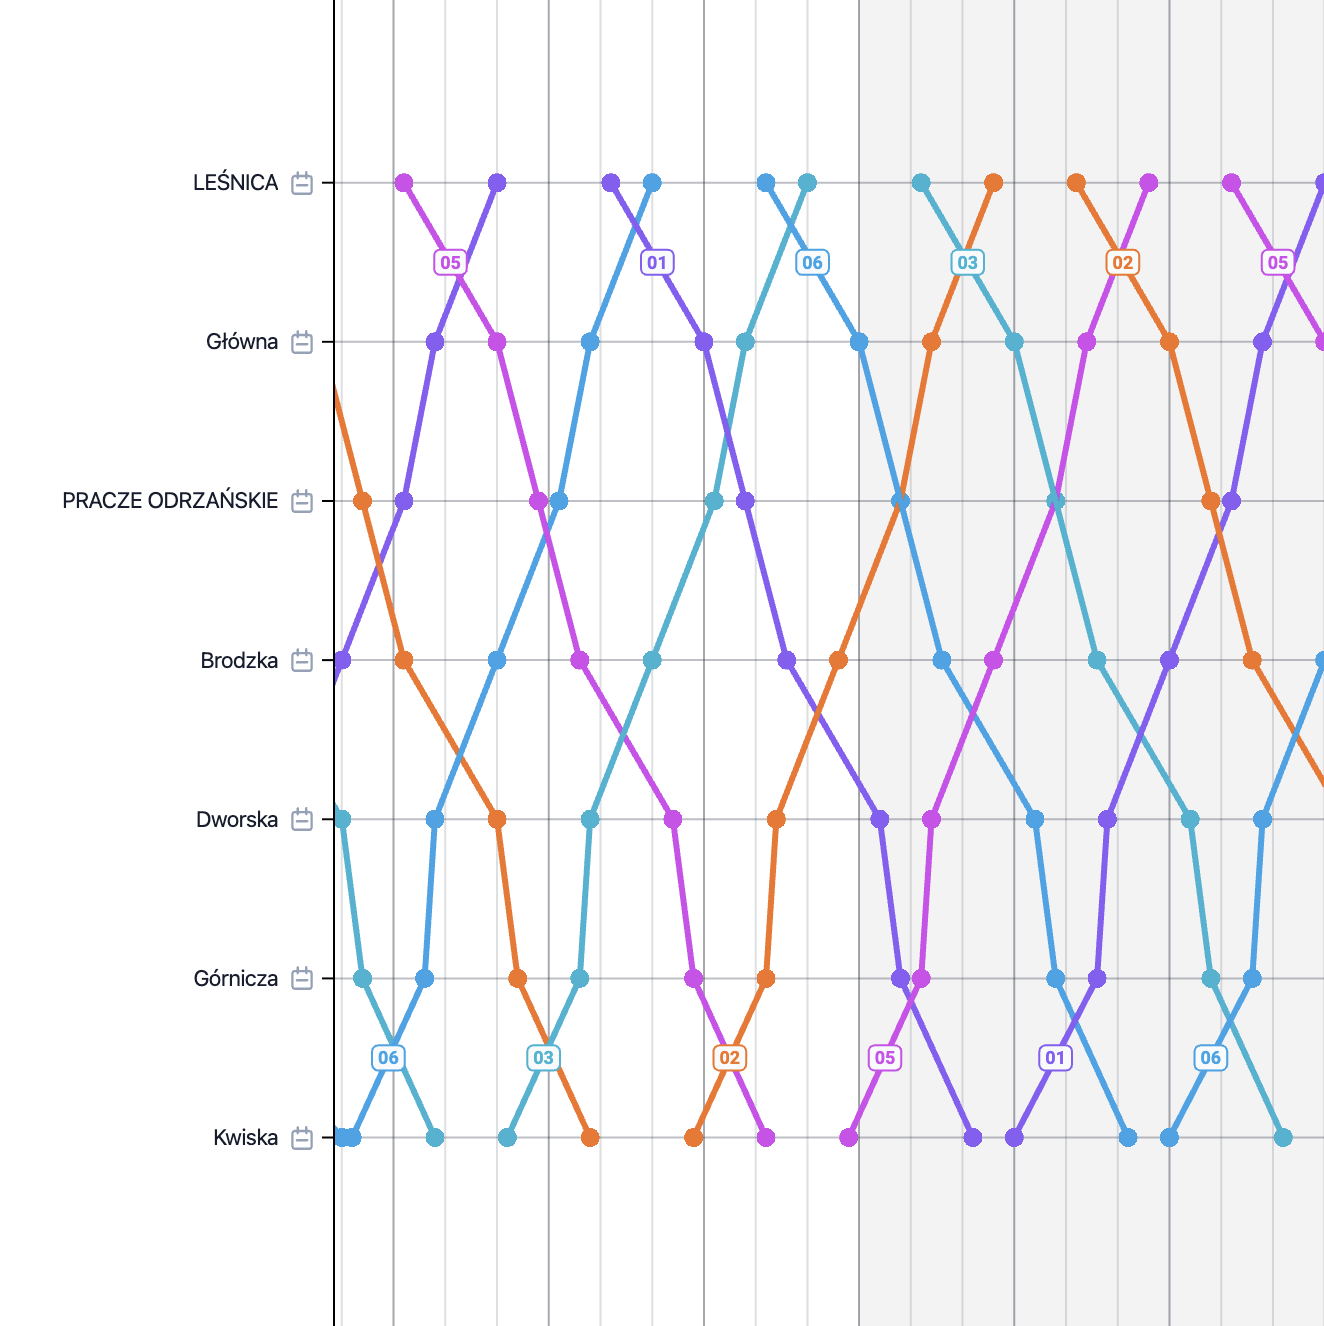
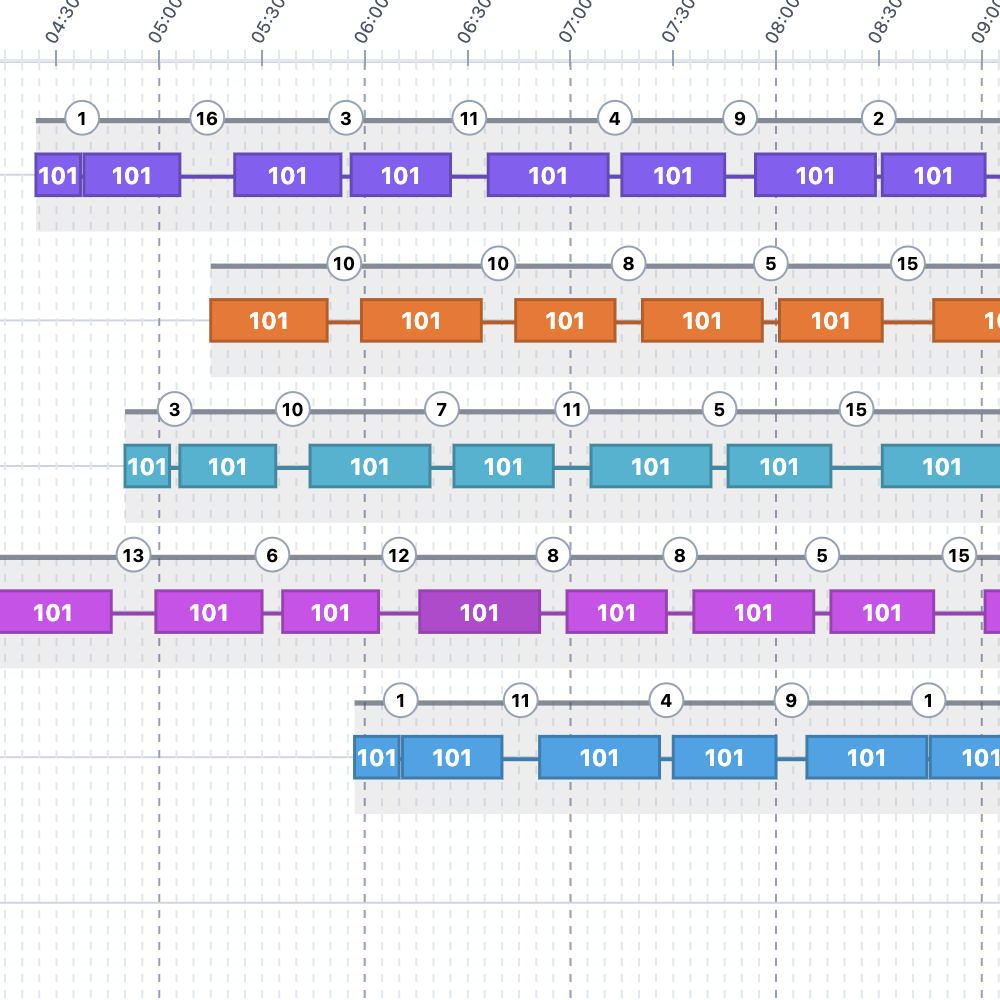
Every part of the network is connected. Changing one run can improve regularity on one corridor and disrupt it on another.

BusHarmony analyses the impact of every change on related corridors and maintains the headway set by the planner.

Improve regularity where it is needed — without breaking it elsewhere.

Transfer synchronisation

A good transfer should not be a matter of luck.

A difference of a few minutes can determine whether passengers make a convenient connection or wait for the next run.

BusHarmony analyses transfer opportunities between lines and helps synchronise runs — including with the timetables of other transport authorities.

More convenient transfers without adding further runs.

Automatic vehicle blocking

The same network. Better use of resources.

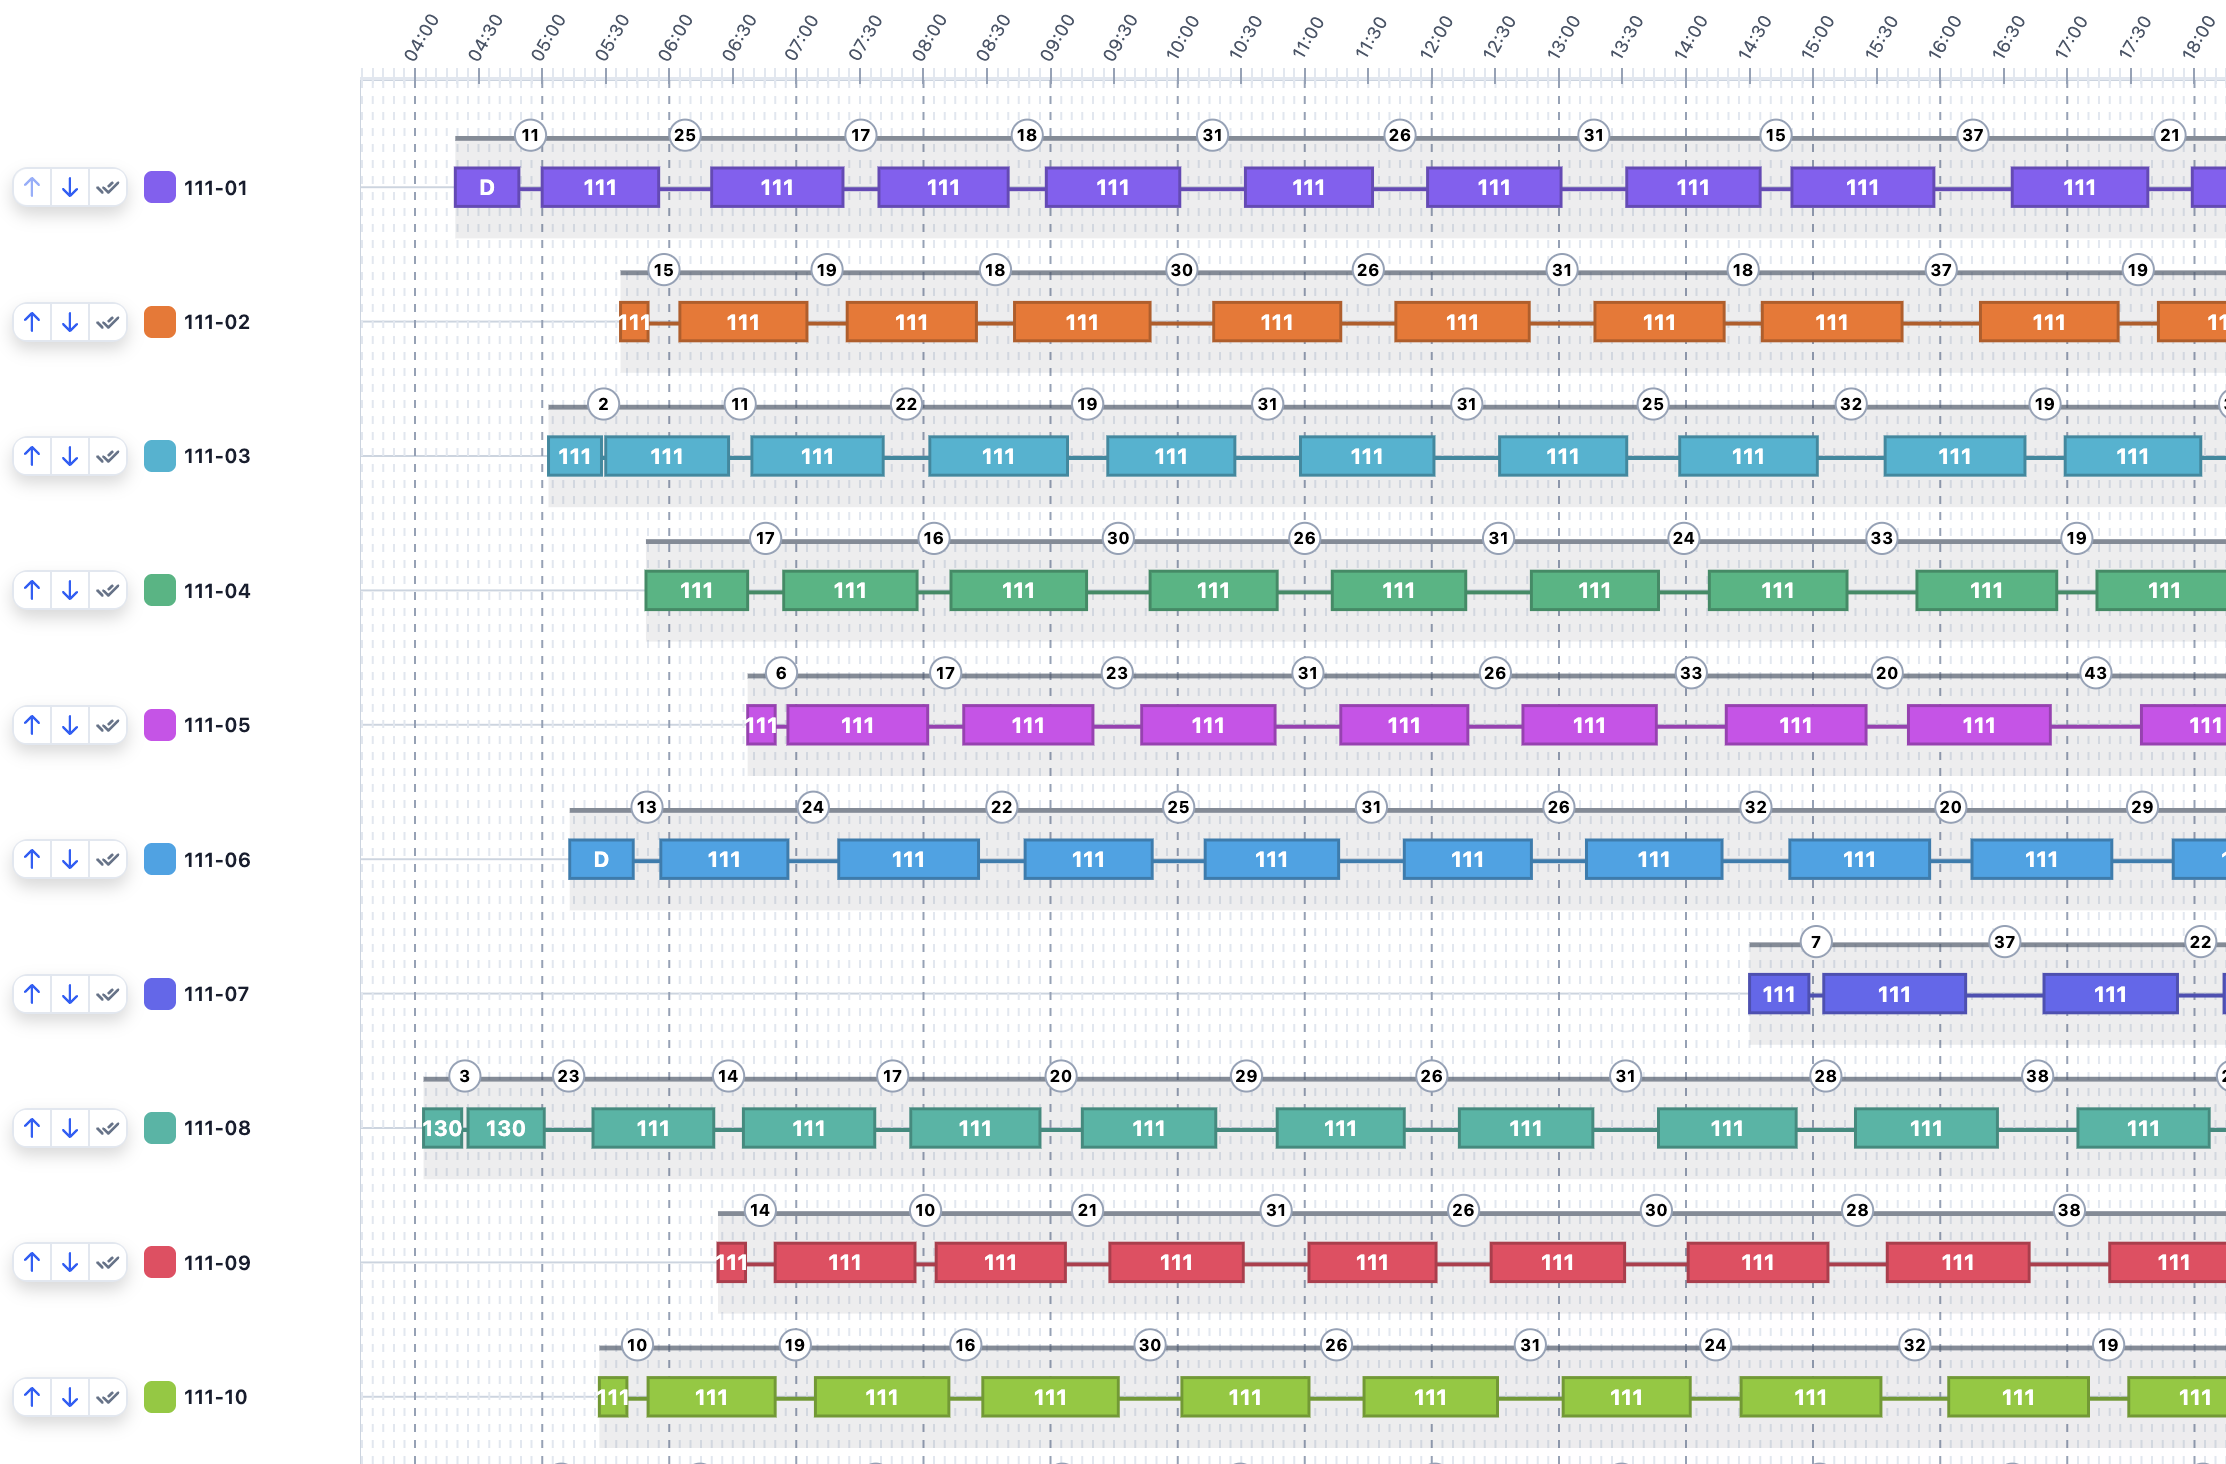
The more complex the network, the harder it is to combine all runs into efficient vehicle blocks.

BusHarmony lets you build blocks manually or use an algorithm that looks for a more efficient arrangement while respecting real operational constraints.

Find options that reduce fleet and driver-hour requirements or make better use of available resources.

Data ready for presentation

Prepare clear materials for presentations, analyses and passenger information.

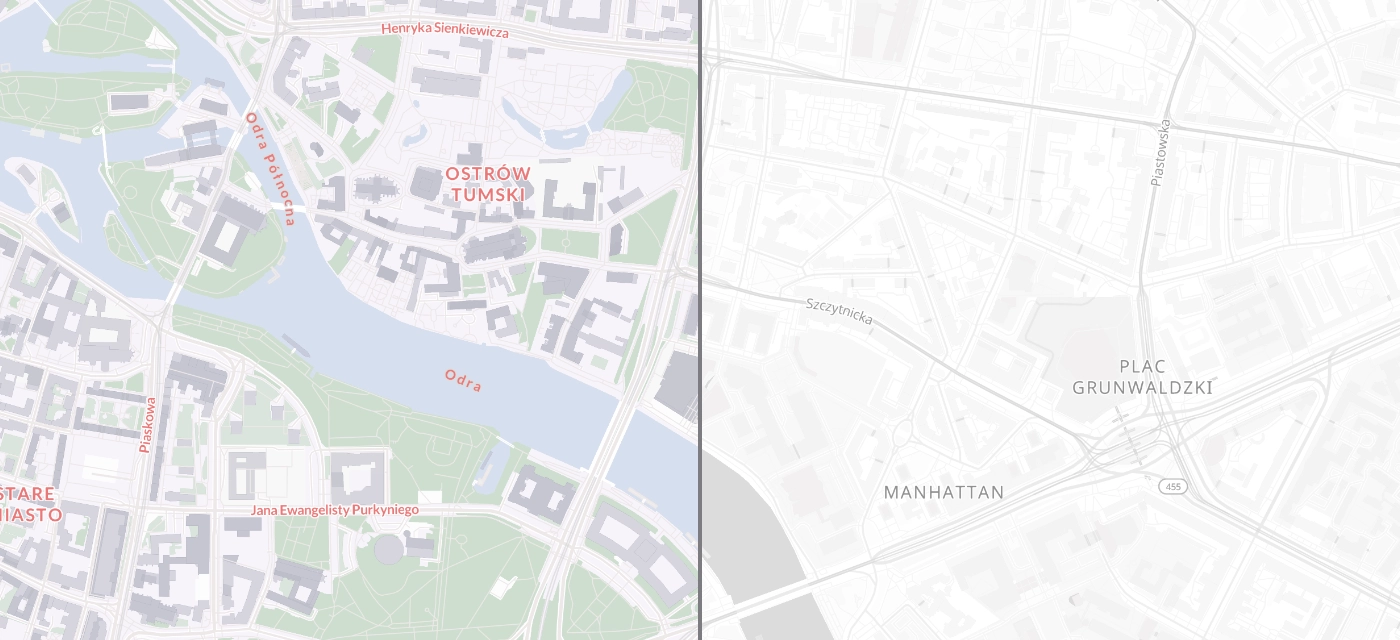
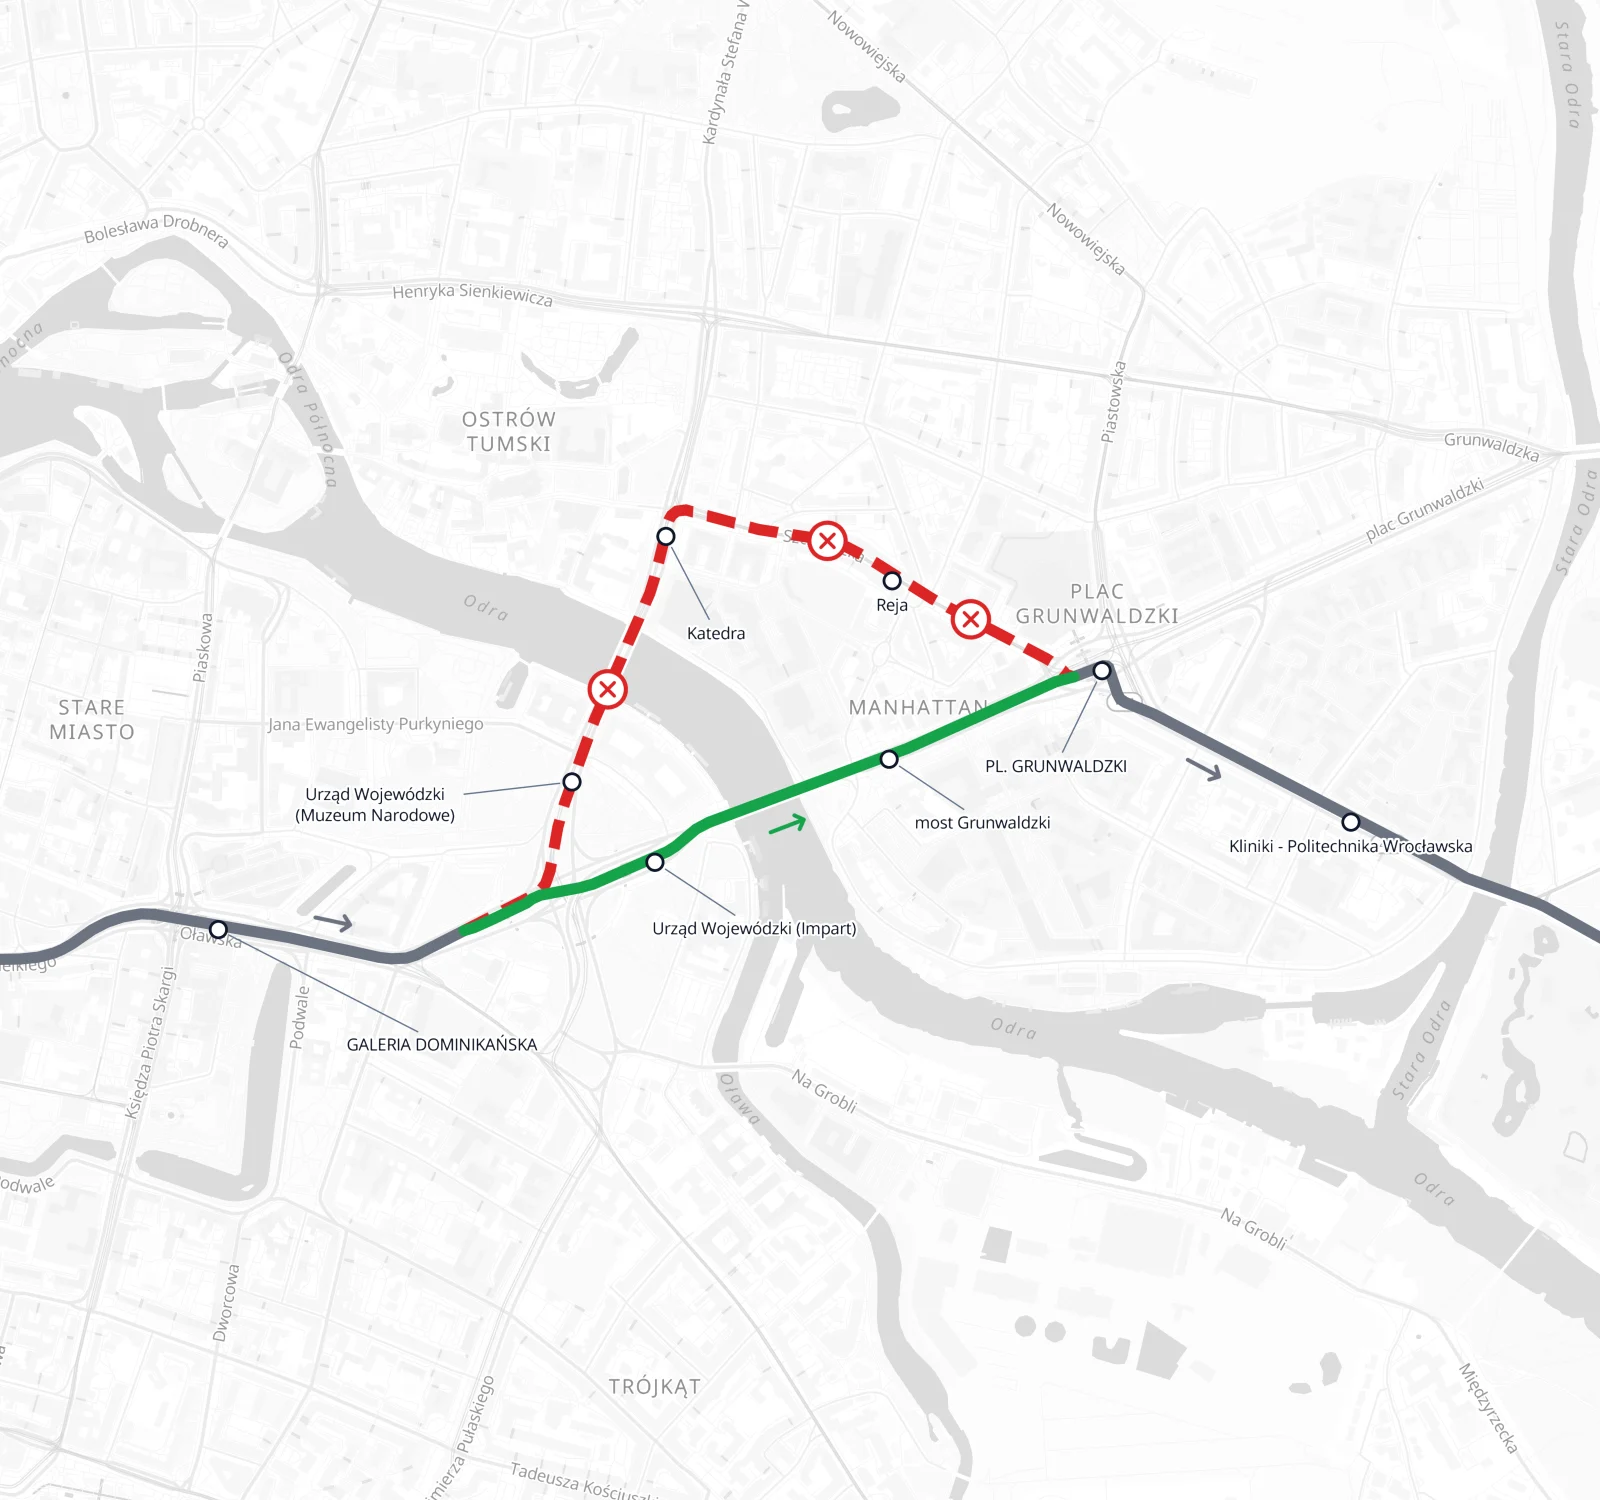
Maps tailored to the purpose

Build a map tailored to its audience. Choose lines, layers, labels, colours and the range of data shown.

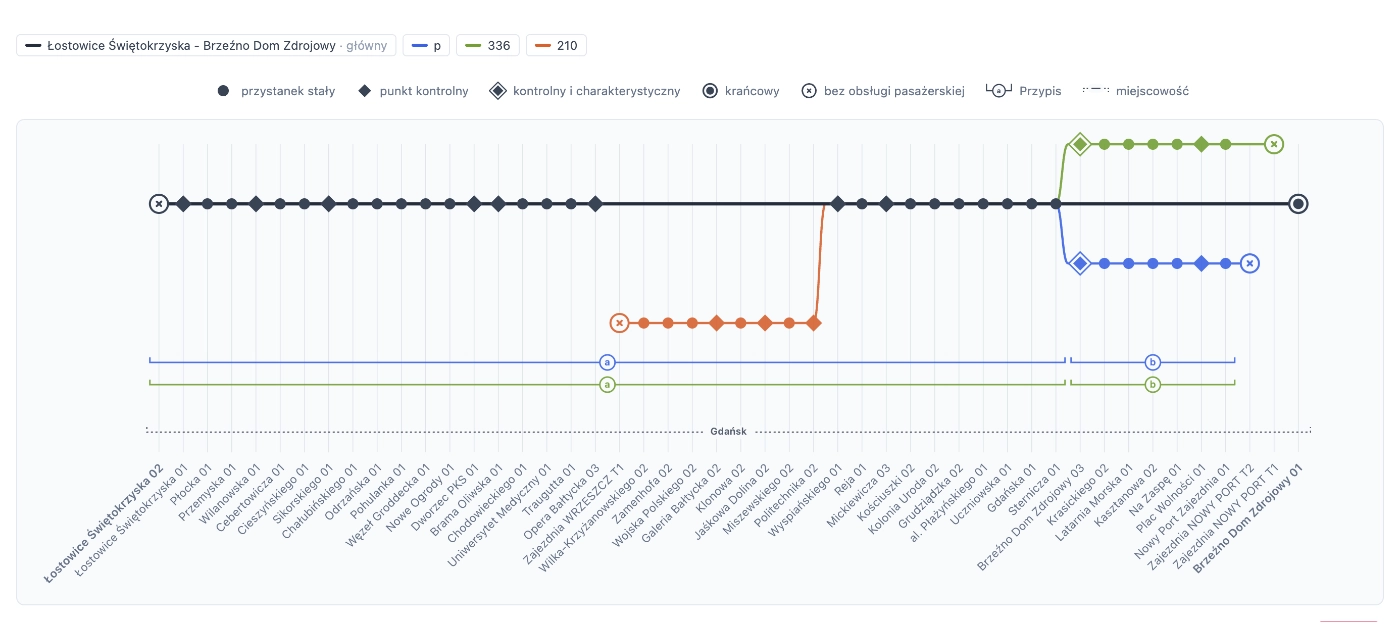
Clear line diagrams

Present the route alignment and stop sequence in a clear, publication-ready form.

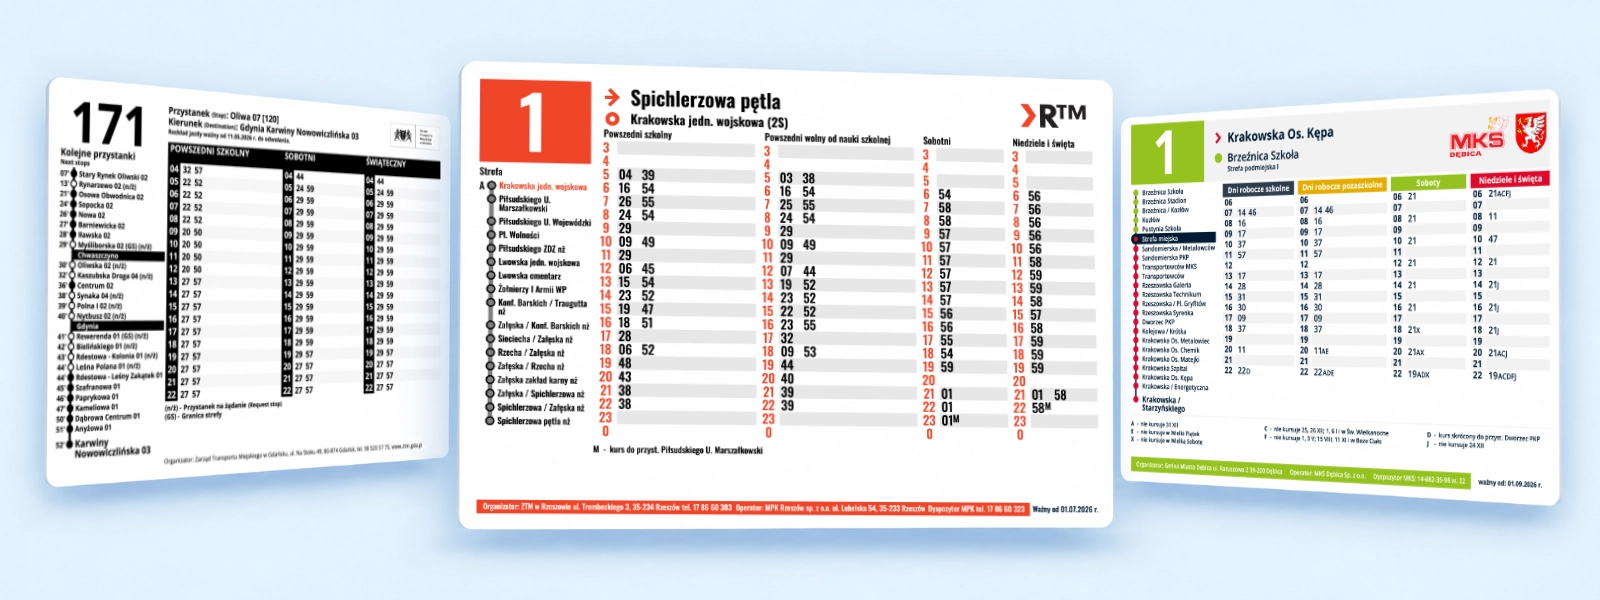
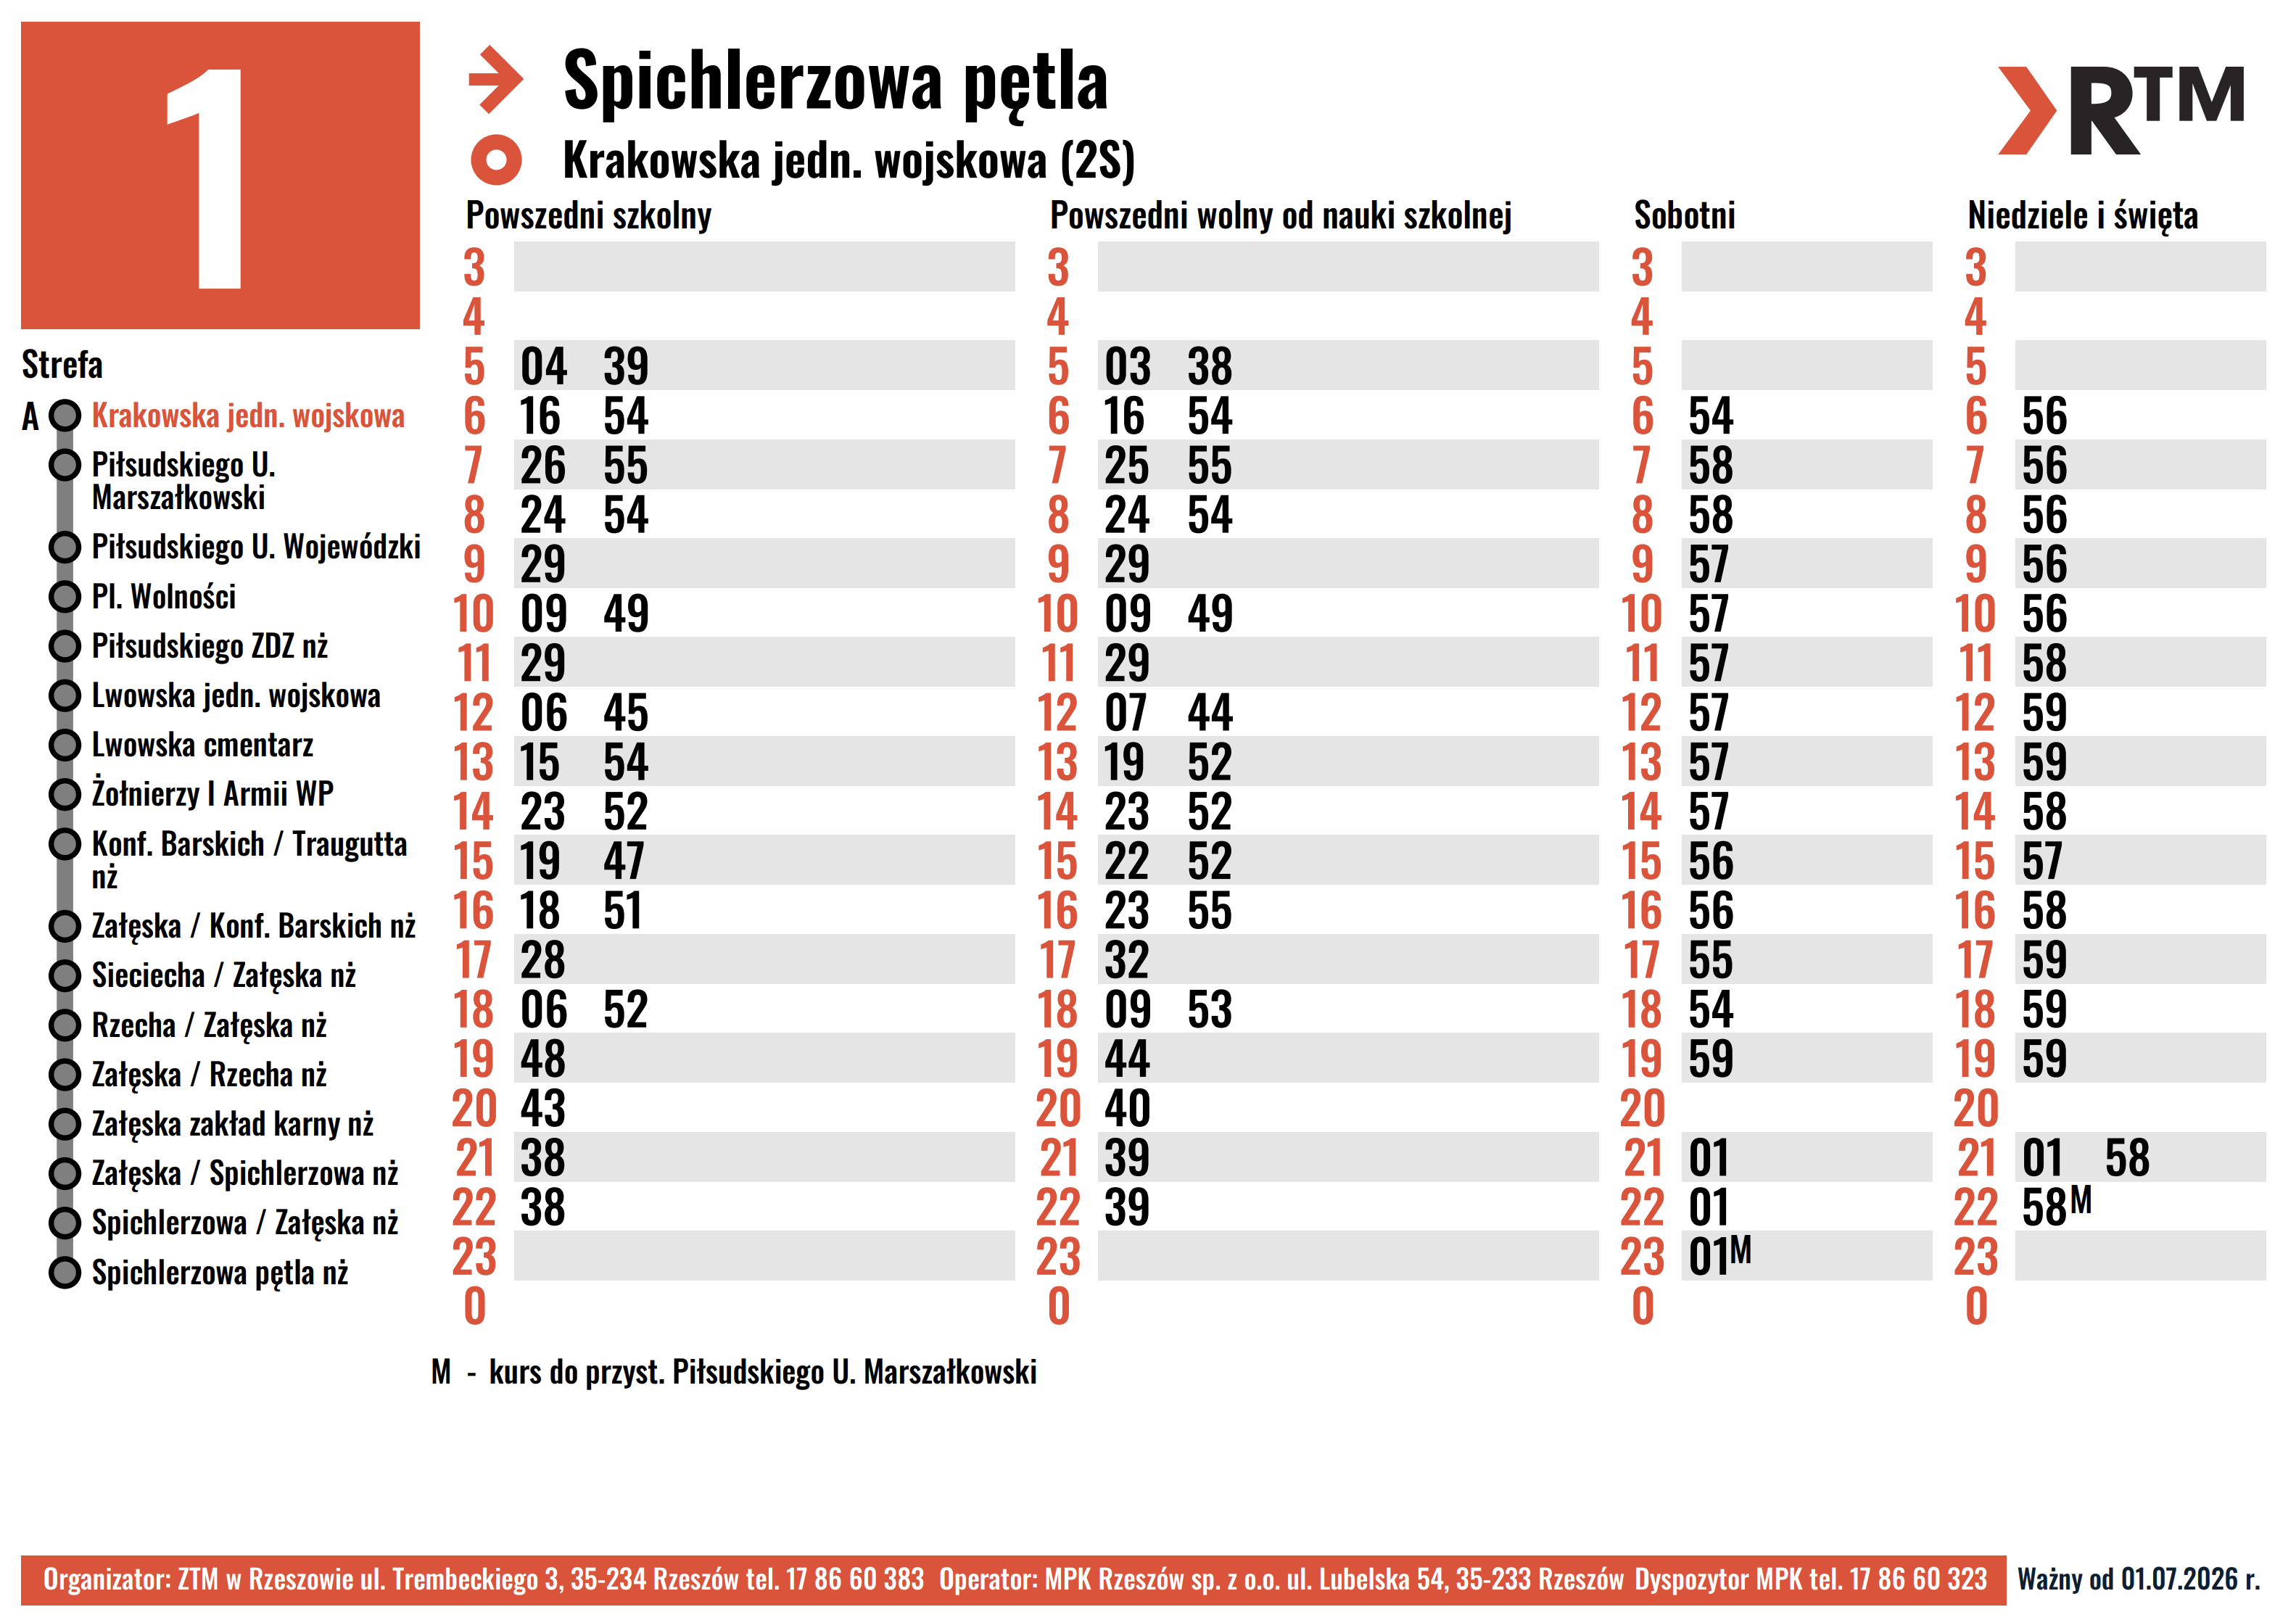
Stop timetables generated from the schedule

Generate up-to-date timetables in batches for selected stops, lines and variants.

Data for analysis and reconciliation

Create operational reports and aggregate summaries ready for analysis, reconciliation and presentation.

Data exchange and publication standards

Publish data using standards designed for the exchange of public transport information.

See BusHarmony on your own network

Share your data with us and we will prepare a demonstration using your network. You will see your own lines, timetables and stops in the system — and how BusHarmony would fit into your team's day-to-day work.